Analytics
Analytics shows how your wall of love is performing across every site it's embedded on. Numbers are collected by the widget itself — no extra script or cookie banner needed.
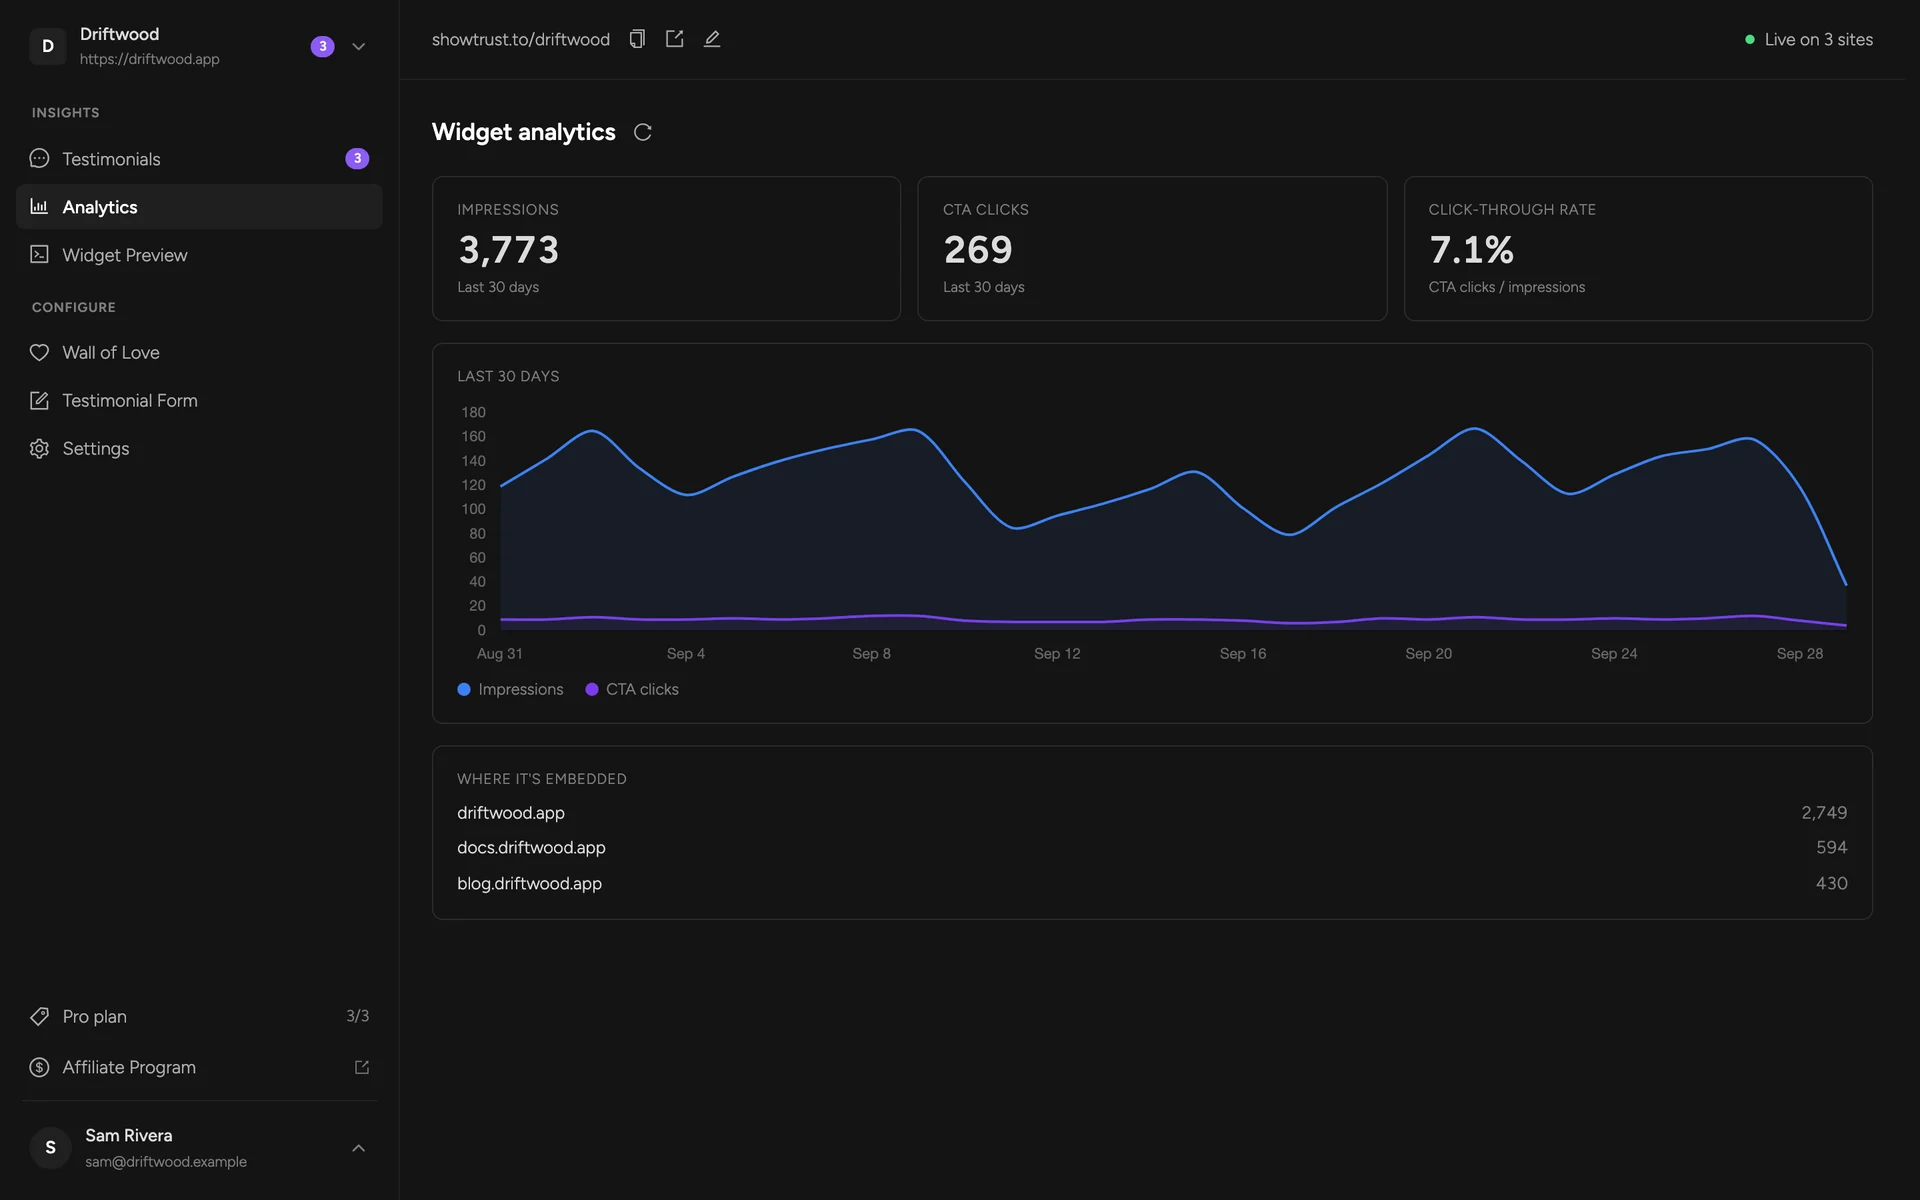
Impressions, CTA clicks and click-through rate for the last 30 days
Daily impressions and CTA clicks
Where your wall is embedded, with impressions per site
Metrics#
- Impressions — how many times your wall was shown on a page.
- CTA clicks — clicks on the wall's call-to-action button, which takes visitors to your testimonial page (turn it on with Show CTA button).
- Click-through rate — CTA clicks divided by impressions.
Last 30 days#
The chart plots impressions and CTA clicks per day for the last 30 days. Hover a day to see its exact numbers. Use the refresh icon next to the title to reload.
Where it's embedded#
Every domain that has loaded your wall, with its impressions. It's also how the dashboard header knows how many sites your wall is live on — see Install status.