June 21, 2026
·
9 min read
9 Testimonial Management Metrics Worth Tracking in 2026
A case-study-style breakdown of testimonial management metrics that actually guide decisions in 2026 — avoid measurement traps, choose metrics via a goal-to-question framework, and track coverage/freshness, credibility, acquisition efficiency, and placement performance.

If your testimonial program is “active” but your pipeline still feels random, the problem usually isn’t effort—it’s measurement. Without the right metrics, you can’t tell whether you’re improving coverage, publishing faster, or just collecting more quotes that never get used.
This case study walks through nine management metrics worth tracking in 2026, plus a simple framework for selecting them. You’ll see where teams misread trends, how to define clean data sources, and which signals connect testimonial operations to on-site visibility and downstream impact.
Why metrics matter
Testimonial management is an operational system, not a content chore. Metrics tell you whether that system is viable: it sustains trust, stays compliant, and influences revenue without adding workflow drag.
Imagine a team that “collects” quotes but can’t verify consent, can’t refresh outdated claims, and can’t reuse proof in sales. You don’t have a testimonial program. You have a liability backlog.
What counts as management
Management covers the full lifecycle, because trust breaks at the seams. If you only measure collection, you miss verification, governance, and distribution.
A real management scope includes intake, proof, publishing, refresh, and guardrails across every place testimonials appear. That includes your site, ads, marketplaces, and sales enablement.
If your testimonials can’t move channels safely, you’re not managing. You’re improvising.
Measurement pitfalls
Bad metrics create good-looking dashboards and fragile trust. Avoid traps that reward output instead of credibility.
- Chasing volume over verified proof
- Reporting in channel silos
- Forcing attribution beyond evidence
- Optimizing quantity over specificity
- Ignoring staleness and consent
Track what stays true under scrutiny, not what spikes in a report.
How to interpret trends
Some metrics warn you early, others confirm the damage later. You need both, or you’ll react too late.
Leading indicators include request-to-submit conversion, verification pass rate, and time-to-publish. Lagging indicators include win-rate influence, churn mentions, and support-ticket themes.
After a process change, expect temporary dips from new friction and seasonality. If movement persists past one cycle, the system changed, not the weather.
Metric selection framework
Picking testimonial metrics is an alignment exercise, not a dashboard exercise. You want numbers that answer real stakeholder questions and expose risk early.
A simple rule: if a metric can’t trigger a decision, it’s decoration. Choose metrics that connect to business goals, have a clear source of truth, and fit your tolerance for noise.
Map goals to questions
Start with the business objective, then force it into questions each team actually asks. If you can’t write the question, you won’t trust the metric.
- Write the goal in one sentence, tied to an outcome.
- Ask marketing what decision they need to make weekly.
- Ask sales what proof removes buyer objections.
- Ask product what feedback changes the roadmap.
- Ask compliance what would create brand or legal risk.
When every metric answers a named question, your reporting stops being a status ritual.
Define data sources
Every metric needs a primary system of record and a backup. Otherwise, you’ll debate the number instead of acting on it.
- CRM for deal notes and stage changes.
- Review platforms for ratings and text.
- Web analytics for page views and clicks.
- Support tools for tickets and tags.
- Surveys for NPS and verbatims.
If you can’t name the source, you’re not tracking a metric yet.
Set measurement cadence
Weekly reviews catch issues early, but they also amplify noise. Monthly reviews stabilize trends, but they can hide a fast-moving problem.
Use weekly for operational metrics like new testimonial volume, approval backlog, and response time. Use monthly for outcome-linked metrics like influence on conversions, pipeline mentions, and category sentiment shifts. Use rolling averages when samples are small or seasonality is strong.
Your cadence is your risk posture in disguise.
Coverage and freshness
You can have great testimonials and still look unproven. Coverage and recency are the signals that keep your proof believable on the pages that matter.
Testimonial coverage
Coverage tells you where proof exists, and where it’s missing. You track it to avoid launching pages that feel like claims without receipts.
Map testimonials across:
- Product line
- Persona
- Use case
- Funnel stage
Then flag gaps that block specific assets, like a pricing page for a new segment. One strong quote on the wrong page is still a hole in coverage.
Freshness index
Freshness is your credibility clock. You measure it because old proof can read like you stopped shipping.
Track two ages per testimonial:
- Days since capture
- Days since last published
A quote can be “new” but invisible if it never ships. And it can be “visible” but stale if it hasn’t been revisited in a long time.
Refresh throughput
Refresh throughput shows whether your proof pipeline actually moves. You track it to find where updates die, not where ideas die.
- Requests sent
- Approvals received
- Updates completed
- Time in review
- Rejections with reason
If approvals lag while requests rise, outreach is fine and review is the constraint. Fix the constraint, not the volume.

Quality and credibility
Testimonials only work when buyers believe them. Track quality like you track pipeline, and you’ll catch trust leaks early.
A detailed, verifiable quote beats a glowing vague one. It also survives legal, platform, and procurement scrutiny.
Specificity score
Specificity is the difference between “great service” and a buyer-recognizable story. Score it so reviewers stop arguing and start agreeing.
- Define a 0–3 rubric for each dimension: context, problem, outcome, constraints.
- Create example anchors for each score level, using past testimonials.
- Calibrate reviewers monthly by scoring the same five samples together.
- Record the average score per testimonial and trend it by channel.
- Reject or rewrite anything below your minimum composite threshold.
When specificity rises, objection handling shifts from your copy to your customers’ words.
Verification rate
Verification turns a testimonial from “nice” into defensible proof. Track the share you can confidently stand behind.
Measure the percent with at least one of these checks: identity proof, customer record match, or platform verification badge. Watch dips by source, since low-verification inflows often come from rushed collection or vendor handoffs.
A falling verification rate is a trust and compliance risk, not a vanity-metric problem.
Compliance exceptions
Compliance issues rarely start big. They start as small misses that pile up.
- Flagged performance or health claims
- Missing written permission or release
- Regulated-language violations
- Unapproved edits after approval
- Unsupported competitor comparisons
Each exception points to a broken step in your intake workflow, so fix the step, not the symptom.
For a baseline on what regulators flag, review the FTC’s Consumer Reviews and Testimonials Rule Q&A.
Acquisition efficiency
You want more usable testimonials with less chasing. Track the effort you spend and the goodwill you risk, not just the raw count. Tools like ShowTrust can help here by standardizing how you request, review, and publish testimonials—so you can measure efficiency across the whole flow, not just “how many did we get.”
Request-to-capture rate
Track how many asks turn into completed, usable testimonials. Segment it by customer type and channel, because one bad segment can poison the average.
For each segment, track: outreach sent, responses started, completions received, and completions approved. Pair the rate with a short “why it failed” tag like no-reply, too-busy, wrong format, or legal hold.
If you’re using a dedicated collection flow (for example, a shareable testimonial link/form in ShowTrust), you can often separate “they intended to respond” from “they dropped off mid-submission,” which makes the fix more obvious than treating everything as a no-reply. Using a testimonial question generator can also improve completion rates by making prompts clearer and easier for customers to answer.
A falling rate is rarely a volume problem. It’s usually targeting, timing, or the ask itself.
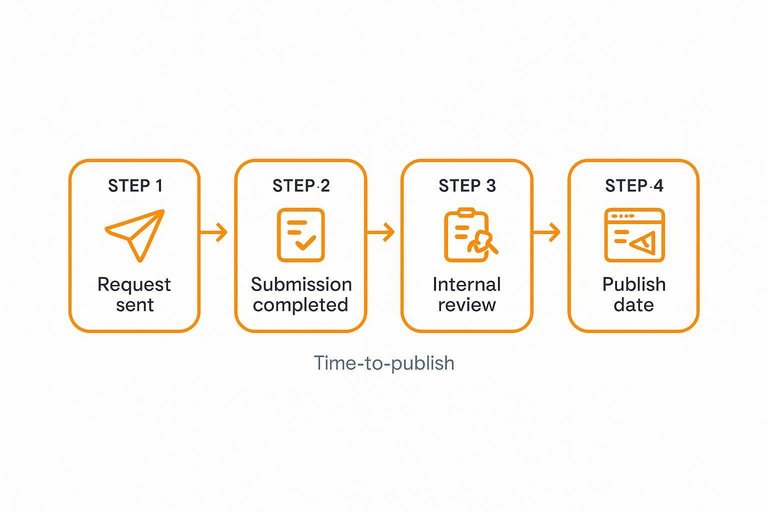
Time-to-publish
Measure cycle time from first ask to live placement, then split the delay by owner.
- Timestamp the request sent and the first customer reply.
- Timestamp the completed submission and any edits requested.
- Timestamp internal review start and approval, including legal if needed.
- Timestamp production completion and the publish date.
- Label each gap: customer, review, or production.
The “publish” step is where many teams quietly stall—especially when testimonials live in docs, inboxes, or design tickets. Having a lightweight approve/organize step and embeddable display (the kind of workflow ShowTrust is built around) can reduce production bottlenecks and make the cycle time visible end-to-end.
Speed exposes process debt. Fix the longest gap first, or you’ll keep “needing more outreach.”
Customer friction signals
Friction shows up before churn. Track early warning signals that your request process is getting annoying.
- Follow-ups per testimonial request
- Opt-out or unsubscribe rate
- Negative or annoyed replies
- Incentive disputes or confusion
- “Not now” deferrals per segment
One practical way to reduce friction is to make the ask simpler and more predictable: one clear request, one short form, and fewer back-and-forth edits. When your process includes a clean submission experience and an internal curation step (rather than repeated email nudges), you often see follow-ups and annoyed replies drop.
If two signals rise together, you’re over-asking or asking at the wrong moment. Tighten triggers and reduce steps, not empathy.
Placement performance
Placement performance ties testimonial placement to real on-site behavior, without pretending you can prove single-touch causality. You’re looking for discoverability and influence signals across journeys, then validating them with conservative checks.
Visibility share
Visibility share tells you whether testimonials were even seen, and where. If you don’t weight by traffic and placement, you’ll optimize the wrong pages.
Treat it as a coverage map:
- Traffic-weighted page coverage: % of sessions landing on pages with testimonials
- Above/below fold placement: first viewport vs later sections
- Component impressions: module render events per session
- Template penetration: which layouts include proof
If visibility share is low, engagement and conversion debates are just guesswork.
Engagement lifts
Engagement lifts show whether visitors interact with proof when it’s present. They signal message resonance and clarity, not purchase intent.
- Expand and collapse clicks on quotes
- Video plays and completion rate
- Scroll depth reaching the module
- Hover or swipe on carousels
- Clicks to “read more” pages
If lifts rise after a copy or placement change, you found a better signal, not a guaranteed sale.
Assisted conversions
Assisted conversions estimate whether testimonials appear on paths that end in conversion. You’ll stay honest by using attribution-light methods that focus on patterns, not certainty.
Use three approaches:
- Path analysis: compare converting paths with and without testimonial exposures
- Holdout tests: exclude a segment from seeing testimonials on key pages
- Pre/post with controls: change placement on one template, keep another stable
For more ideas on what to test, see advanced social proof widget patterns.
If your checks disagree, trust the most conservative read and rerun the test with cleaner exposure rules.
Turn the Metrics Into a Monthly Operating Rhythm
- Pick 1–2 metrics per section (coverage/freshness, credibility, acquisition efficiency, placement performance) and assign a single owner for each.
- Define the source of truth and a measurement cadence (weekly for throughput and time-to-publish; monthly for quality and placement performance).
- Review trends, not single points: add one “what changed?” note per metric and link it to an action (refresh, request flow tweak, verification policy, or placement test).
- After 30–60 days, prune vanity metrics and keep only the ones that consistently lead to a clear next step.
Turn Metrics Into Trust
Tracking coverage, freshness, quality, acquisition efficiency, and placement performance is powerful—but only if your team can collect, curate, and publish proof consistently.
ShowTrust helps agencies request testimonials via a shareable link, approve and organize them, and display verified social proof with embeddable widgets and a public wall to lift conversions.
Written by
ShowTrust
Notes from the ShowTrust team on collecting testimonials and building authentic social proof.
Share: